POSTED 11.11.22 / BY C YATES
WHAT I LEARNED TRACKING MY WELL-BEING FOR A YEAR
CATEGORIES
Design
Future
Connected
Methodology
Innovation
Technology
ABOUT ME
I am passionate about innovative design and creating user experiences at the intersection of art, science and technology.
RELATED POSTS
Design Methods
Cultivating Micro-Moments
In the last few years a pandemic sized spotlight has highlighting the issue that more and more people are facing mental well-being challenges. Prior to the pandemic around 1 in 4 people were thought to be facing a mental health challenge, during the pandemic this was thought to be closer to 1 in 3 people. I am someone who faces their own personal mental health challenges and made the decision during the pandemic to also focus my professional life to bring awareness to the issue; in co-founding uMore, a digital technology startup dedicated to using science in helping people understand more about their mental well-being, suggest actions and activities to help deal with challenges, and monitor progress over time.
Our initial research uncovered an unmet need around helping people understand the wealth of science that can explain what they are experiencing, why they are feeling the emotions they feel, and how might they use relevant tools and coping strategies to deal with negative emotions and move from languishing and surviving to flourishing and thriving.
Part of the solution was to combine new digital technologies, the data that smartphones and wearable devices continuously collect as we go about our lives, with the science of mental health, and methods for behaviour change. The continuous collection of smartphone data has been referred to as digital phenotyping. One of the greatest benefits to leveraging smartphones is their ability to collect many disparate variables concurrently. In general, data types are categorised as active or passive data. Active data is captured through conscious user engagement such as a self-reporting mood level, journalling, and completion of health surveys for stress (PSS-10), anxiety (GAD-7) and depression (PHQ-9); passive data is captured without conscious user engagement (ie, the user does not submit experiential data explicitly) such as the phone recording movement as steps, activity, sleep, meditation, location and other aspects of our digital lives.
Key to effectively using the data collected from digital phentyping was to understand the effect each data element has on the users well-being (both physical and mental), and how to spot patterns in the combinations of data to help machine learning algorithms, with the aim to develop predictive capability in high-lighting triggers that may impact a users well-being before they can take effect. In order to facilitate this understanding I used my own situation and decided to quantify and measure every aspect of my physiology along with self-reporting data gathered at several times throughout each and every day. To begin with I did not envisage needing to do this for more than a few weeks, however it became clear that observed changes in some of the data trends and emerging patterns would require much longer time periods, and so this is how the experiment continued for a whole year between April 2021 and March 2022.
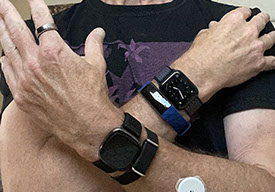
To help with this I used an Apple smartwatch for steps, exercise, heart rate (HR), heart rate variability (HRV), and activity data, a Fitbit Sense smartwatch for comparative step count, sleep, and its capability to measure stress using an EDA sensor, an Oura ring for body temperature and sleep tracking. In addition the iPhone provided location data, local weather, and screen time, plus I later added a blood pressure tracker and a Muse headset to capture EEG brain activity in relation to active, neutral, and calm modes. Apple Health was used as the main mobile app to collect data, along with the Fitbit app which was able to provide sleep duration, sleep quality, and a derived Stress management score. The Oura mobile app provided a detail breakdown of sleep in relation to light, REM, deep, and awake, along with a readiness score related to activity, recovery, and sleep levels. I entered all the app data into a spreadsheet along with daily mood checkins, emotion journalling, and level of stress, anxiety, depression from self-reported surveys, and I derived an initial well-being algorithm score based on a combination of mood level, emotion word sentiment, and the % variation from daily normal levels of stress, anxiety, depression, sleep, and activity. In addition other data points were collected on an ad-hoc basis such as glucose level, sweat and hydration level, facial EMG emotion detection using the phones front facing camera, and reaction times calculated using a mobile app.
All the data was recorded at least 3 times each day (nominally in the morning after waking, around midday and in the evening) and entered into the spreadsheet. Practical aspects needed to be managed such as charging the devices at suitable times such that they could continue to record data through the night, and using elasticated straps for the smartwatch which I found was significantly more comfortable for extended wear periods than the rigid plastic or metal straps.
Like many people, lock-down had quite an impact on my mental well-being, some positive and some negative. Having to adapt to a new routine, having to change to a situation where the house became both a workplace and a rest place both for me and my gown-up family, along with the challenge of conducting work activities via conference calls, emails, and collaborative software tools. Add to this the extra stress of changing jobs which involved starting a new company, and dealing with the breakdown of a relationship. I was particularly interested to understand what impact all this was having on my mental well-being, and what effect different actions and activities would have.
Do you remember where you were or what you were doing on Sunday 4th April 2021 at 11.05am? For me the sun was shining and I was about to baseline all the key data points I wanted to quantify and measure; starting with mood, emotional tag words, and stress, anxiety, depression levels, through to baseline measurements of resting HR, HRV, and reaction time. I also set the ideal (target) levels for my stress, anxiety, depression, along with sleep and activity, according to the prevalent scientific research, accounted for my age, gender, ethnicity, and location. I recall that the action of collecting all the data on myself and the insights this may reveal was quite cathartic and somewhat uplifting which reflected in my initial mood level as being happy, this was tempered somewhat by the baseline results indicating my stress as moderate (on a scale rising from low, mild, moderate, to high) which was not so surprising, but I was surprised to find my anxiety was also moderate, and depression was mild, My resting HR also seemed higher than expected at 76bpm, and my HRV baseline was 20 although I had no idea at this time if this was good or bad. I could see from other data that my sleep at 7hr was below the recommended goal of 8 hours, and that my activity level was near zero. This all added up to a well-being score of 49 out of 100 (higher is better with scores around 90 representative of someone who is flourishing and thriving). To a large extent my baseline result was not unexpected given what I was feeling and experiencing around that time, but still represented a wakeup call and I knew from the science that, whilst this was not too serious in isolation, staying at this level for an extended period of time could have a longer term impact on my health and well-being.
HRV or not HRV that is the question?
Most people understand that heart rate HR measure the beats per minute of the heart as it pumps blood around the body. Resting HR is a good indicator of both fitness level and also anxiety, as a high HR not associated with physical exercise may mean the mind is experiencing anxious thoughts, reflected in the physical body increasing HR and often described as heart palpitations, and also why many people experience cold sweats when feeling anxious.
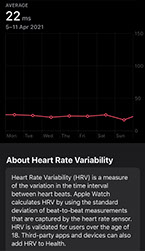
Heart rate variability HRV on the other hand is a measure of the variation in time between each heartbeat. This variation is controlled by a primitive part of the nervous system called the autonomic nervous system (ANS). It works behind the scenes, automatically regulating our heart rate, blood pressure, breathing, and digestion among other key tasks. The ANS is subdivided into two large components: the sympathetic and the parasympathetic nervous system, also known as the fight-or-flight mechanism and the relaxation response. The brain is constantly processing information in a region called the hypothalamus. The ANS provides signals to the hypothalamus, which then instructs the rest of the body either to stimulate or to relax different functions. It responds not only to a poor night of sleep, or heightened stress, but also to excitement or a healthy meal. If we have persistent instigators such as stress, poor sleep, unhealthy diet, dysfunctional relationships, isolation or solitude, and lack of exercise, this balance may be disrupted, and your fight-or-flight response can shift into overdrive.
HRV measures this variation in milliseconds and the data captured by Oura, Apple Watch, Fitbit, and other wearable devices is largely parasympathetic activity, due to how the parasympathetic system impacts heart rate beat-by-beat. HRV data works in the opposite way to HR data where a higher HRV is associated with rest-and-digest, general fitness, and good recovery, and a lower HRV is associated with fight-or-flight, stress, or illness. The key fact about HRV is that there is no “optimal” HRV for men, women, or even a certain age group. HRV is a highly sensitive, individual metric that varies from person to person, and can change daily, or even hourly. General observation is that HRV is much higher for younger people than older people. Multiple, population-based research studies confirm that HRV tends to decline with age. Some research suggests that this decline likely reflects the normal ageing process. While HRV is specific to the individual, there are some factors that can impact the score. These factors include sleep hygiene, nutrition (including caffeine, alcohol, and hydration), stress levels, and level of physical fitness.
It was important when considering HRV data in my experiment to establish a baseline by averaging the day and night data recorded over several days, and to keep adjusting this baseline with the averaging of HRV data over ever increasing time periods. How current HRV values compares to the baseline, and whether this trends up or down, can help you know how to approach your day (e.g., prioritising rest or face a challenge). Comparing your daytime check-ins to your general baseline can give you insight into how certain activities, like meditation or exercise, affect your system. How HRV trends over a few weeks can help you identify if you’re successfully rebounding from taxing days (e.g., training, illness, stress), and how HRV changes over months can reveal how major lifestyle changes (e.g., a new job, being in lock-down) are impacting your health.
It was clear that HRV is potentially a useful measure for stress, sleep quality, nutrition, and fitness, however it cannot be seen as an immediate indicator, but requires establishing a personal baseline, observing positive or negative trends in HRV in relation to context, and to compare weekly and monthly HRV trends to the baseline to understand changes in HRV balance.
It is now a cloudy morning on Wednesday 7th April 2021 at 9.31am three days into my experiment. In this part of the experiment I had set the period for updating the self-report health data to be on a weekly basis, so my reported levels of stress, anxiety and depression were unchanged. As previously explained my HRV was still being baselined and resting HR was still hovering around 70bpm. Even though I was now more aware of my sleep patterns and activity levels these were roughly the same. For all intents and purposes it would seem that my data was not changing, and this is something that many people experience when tracking or quantifying physiology, our bodies react to external stimuli but are slow to change in any measurable way. However I was seeing an increase in my daily average well-being score from 49 to 60. The reasoning for this was, whilst my physiology was not measurably changing, my mood and emotion sentiment (tag words) had more positive states along with more occurrence of words such as calm and optimistic. This was helping to boost my sense of well-being which was reflected in an increased score.
Mood and emotion a tale of two cities!
Changes in mood is something we all experience and is a natural part of your emotional rhythm. Most research point to three factors that combine to create the mood emotion in the brain: biology (for example, hormones and brain chemicals), psychology (such as personality and learned responses), and environment (like illness and emotional stress). Common, everyday causes that can lead to a negative mood are: stress, lack of sleep, overwork, poor nutrition, the interactions with the people around you, the news, the weather, lack of exercise or need for a break, drugs and alcohol, medication side effects, and chronic health issues.
The environment can also affect your mood in many ways, including certain chemicals can trigger a negative reaction, such as additives and preservatives in food, or pesticides used in farming. Seasonal fluctuations in daylight and weather - bad weather or limited daylight can make you feel flat or make life harder to manage. Noise pollution and poor air quality can also affect mood and impact on mental and physical wellbeing.
Tracking helps identify patterns in mood and factors that affect emotions. This can help to better understand emotions or to target unwanted behaviours or coping methods. Unlike many of the physiological factors mood and how you are feeling can change throughout the day. Noting these changes can help identify both emotional and external triggers that affect how you feel. In addition relating the mood and emotions to the physical data can high-light how lifestyle, diet, sleep patterns, and activity levels all affect mood. With this you can begin to predict when certain situations will lead to negative emotions and develop healthy coping mechanisms for handling them. In effect you become more attuned to what factors worsen or benefit your mental health and know when to reach out for help.
With mood it is important to try and capture the change as it happens rather than retrospectively, in this way it is easy to spot changes relating to certain times of the day. It is also important to capture the context of what was happening around you when you felt the emotion, since this will help to spot patterns related to key contextual and environment factors outlined previously. Having an easy way to document the mood level using a emoji scale is by far the most simplest way to record mood, and offers a visual way to chart mood patterns over the day, week, month and year. Indicating mood on an emoji scale is only part of the story, it is also important to identify what you are feeling in terms naming of the emotion. Using a pre-defined set of emotion words to tag the feeling is a consistent way to capture this information and can be more easily used in spotting patterns and casualties. It was the daily recording of changes in my mood and the new emotion tag words I used that was responsible for the slight uplift in well-being. However as mentioned previously mood is a reflection of our emotional rhythm, and I would see this play out as in the following days my mood dropped, lowering my well-being score, but then rising again as the weekend approached.
It is now 15.49 on a cloudy Sunday afternoon of 11th April 2021. I have completed my first week of the experiment. On a positive note I ended the week with a higher well-being score than I started, mostly due to slight increases in mood level. Other data points such as activity, sleep, HRV, RHR were either flat or trending in the wrong direction. It was evident even after just 1 week that many of the factors respond differently with time, and some of the indicators will only come into play as time passes and more data is collected. The following day was the start of a new week and with this the renewal of the self-report health surveys.
GALLERY


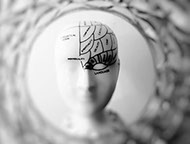
Digtial Phenotyping measures the mind by interpreting physiological data
Car sharing services CSS are looking to change face of cities and urban life
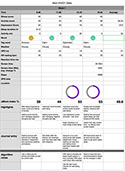
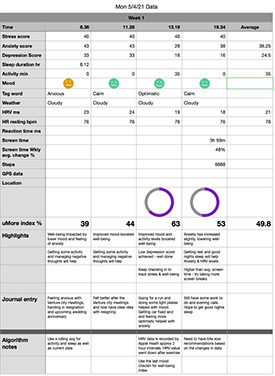
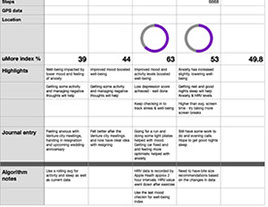
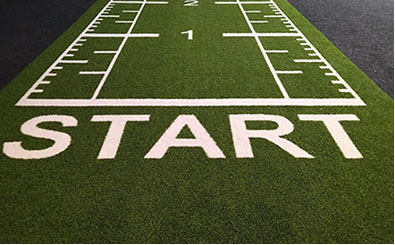
Daily data capture - start of the experiment
Heart Rate Variability
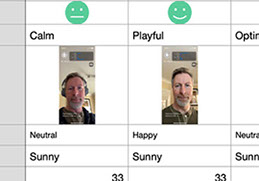
Capturing mood and emotion
Journaling is useful way to accept mental health experiences
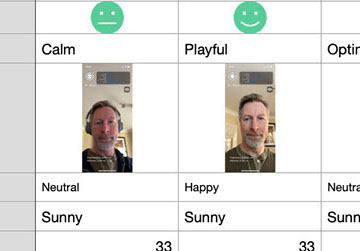
Adding the mood selfie - Facial EMG into the mix
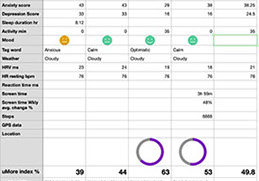
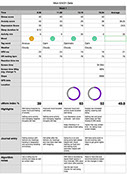
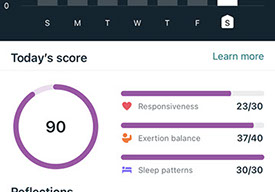
Fitbit stress management score - towards end of the experiment
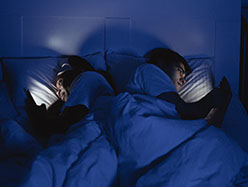
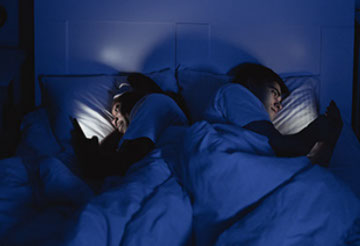
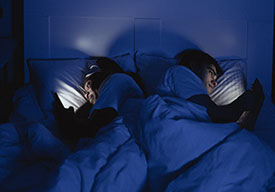
For a good nights sleep avoid electronic devices late at night and in bed
Walking just 15minutes each day can help you live longer!
Eating healthy and whole foods can boost well-being
Start small, build on positive changes, and just keep moving forward
The quantified self!
The sequel is in progress!
<
14 - 14
>
Curious and curiouser; Self-reporting and Journaling
To get a science based indication of stress level the Perceived Stress Scale PSS-10 is a 10-item questionnaire originally developed by Cohen et al. (1983) and widely used to assess stress levels in people aged 12 and above. It evaluates the degree to which an individual has perceived life as unpredictable, uncontrollable and overloading over a given time period, in my case I chose to repeat the survey each week. The questions ask about your feelings and thoughts during the last week. A total PSS-10 score ranges from 0 to 40 with higher scores representing higher levels of stress. Norms have been determined for the total score (by age) where under 25s a mean of 16.78 is a good score, for 35-44 year olds this is 16.38, and with 55-64 year olds this lowers to 14.50, and over 64s this is even lower at 11.09. Percentiles are also presented, comparing the results to a community sample (Cohen & Janicki-Deverts, 2012). A percentile of 50 indicates that an individual is experiencing an average level of stress when compared to other members of society. On that Monday of April 12th my PSS-10 score was 22/40 or 55%, indicating moderate stress, slightly above average, but importantly for my well-being algorithm 34% above my norm of 14.5 based on my age and gender.
To measure anxiety the Generalised Anxiety Disorder (GAD-7) assessment was used. This is a seven-item instrument that is used to measure or assess the severity of generalised anxiety disorder (GAD). Each item asks the individual to rate the severity of his or her symptoms over the past week. Response options include “not at all”, “several days”, “more than half the days” and “nearly every day”. Total score for the seven items ranges from 0 to 21 and the following cut-offs correlate with level of anxiety severity; 0-4: Low, 5-9: Mild,10-14: Moderate, scores over 15: High. For me at that time my score was 11/21 indicating a moderate level, but more importantly 33% above the target breakpoint for low anxiety.
Finally to assess my level of depression I used the Patient Health Questionnaire (PHQ-9) an easy to use questionnaire for depression, which scores each of the nine criteria as "0" (not at all) to "3" (nearly every day). It can be used to monitor the severity of depression and response to treatment. Total scores range from 0 - 27 and have breakpoints of 5, 10, 15, and 20 representing low, mild, moderate, and high depression, respectively. My score on that cloudy Monday morning was 9 indicating mild depression, but also 14.5% above the target breakpoint for low depression.
The health surveys represent a proven scientific way to measure levels of stress, anxiety, and depression experienced in the past week. They are not meant to provide a real-time continuous status, and are retrospective in nature, with answers based on feelings and experiences in the past. However they have been used extensively on wide populations for decades, so provide a high level of efficacy. With all the wealth of historical data the normalisations, and breakpoints can be trusted which means that along with knowing where your current levels of stress, anxiety, and depression are, they can be compared with norms for age and gender, and target breakpoints to establish a % gap between where you are and targets for a flourishing and thriving well-being. Variations in the % gap can then be used to help indicate the overall sense of well-being via the score.
Along with the weekly health surveys, I also journaled my thoughts each day as well as helping to document some of the immediate findings from the experiment, it also provides a way to off-load thoughts clouding up my mind, allowing me some small release to move forward with the day. Research suggests that journaling can help us accept rather than judge our mental experiences, resulting in fewer negative emotions in response to stressors. Study findings suggest that accepting our feelings is linked to better psychological health and positive therapeutic outcomes, including improved moods and reduced anxiety. Keeping a record of personal thoughts and feelings is thought to specifically help with reducing anxiety, breaking away from a nonstop cycle of obsessive thinking, improving the awareness and perception of events, regulating emotions, promoting awareness, and boosting physical health.
The Rolling Averages playlist!
It is now Friday 16th April 2021 2.53pm on a sunny afternoon. Twelve days into the experiment. With each new week it is now possible to compare the daily average scores with the previous weeks same day average. For me this highlighted a 7% improvement in sleep duration, a 25% change to HRV baseline, a 45% increase in step count, and a slight reduction in the resting HR compared to the same day on the previous week. Along with experiencing a relatively good mood during the week this contributed to achieving a new highest well-being score of 75 (overall avg. for the day was 66.3 representing a 16.8% increase on the previous week).
To help with how sleep duration and activity are calculated and the feedback of data into the well-being algorithm a rolling average for the week was calculated, this is then compared to the weekly average goal. World Health Organisation (WHO) guidance on exercise recommends at least 150–300 minutes of moderate-intensity aerobic physical activity; or at least 75–150 minutes of vigorous-intensity aerobic physical activity; or an equivalent combination of moderate- and vigorous-intensity activity throughout the week spread evenly over 4 to 5 days a week, or every day. it is possible to do 25 minutes of vigorous exercise on 4 days during the week and still meet the accepted levels. This means there may be some days where activity is recorded as well below the daily target but the weekly rolling average is still on track, so the well-being index should both track the rolling weekly average and compare this with the previous weeks average to provide a direction of trend, and also the daily level and intensity to reflect the positive boost of doing more than the recommended exercise on that day.
With sleep duration a similar scenario exists where there is a recommended daily target of 8 hours, and a rolling average to compare with the previous weeks average to provide direction of trend. In addition as lack of sleep is a compound effect where 3 or more continuous days of poor sleep has a higher effect on well-being than a single night of poor sleep and this was reflected in the well-being score.
The mood selfie - Facial EMG!
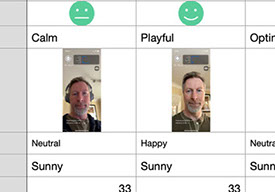
This week saw the addition of a new data point to the experiment to test its potential benefits to simplifying the data capture process, that of Facial EMG. Electromyography (EMG) is the measurement of the underlying electrical activity that’s generated when muscles contract. Facial EMG, specifically, pertains to electromyography that is specific to the muscles of the face that can be used to detect facial expression (Ekman & Friesen’s Facial Action Coding System FACS), where facial expressions are divided up into Action Units representing individual movements of the face. The Action Units described in FACS relate to Joy, Surprise, Fear, Anger, Sadness and Disgust. These can be mapped to the same emoji icon selections that are used to capture mood. Since all smartphones now have a front facing camera, there is a way to use the camera and the FACS analysis to automatically determine mood level. Early testing gave mixed results with 70% correlation to the manually selected mood emoji. However a potential useful side effect of using the Facial EMG detection was that a photo image ‘selfie’ of the face was captured at the same time, giving a more personal view to the reflective historical analysis of mood, by being able to browse through my mood ‘selfies’.
It is now Sunday 2nd May 2021 at 10.41 in the morning and I have completed my first month of the experiment. What has changed since I first started this self-quantification exploration of my well-being? Well my well-being index is now an average of 77.4 which is over 25% higher then when I first started. My stress levels have come down by 20% are are presenting as mild, equally and more importantly to me personally, my anxiety level has also come down by 30% and is presenting as low to mild. Whilst this is all very good news, I am also noticing that the data trends are becoming flat. It is common to experience ‘plateau periods’ when undergoing any change as you assimilate the changes and look to find ways to continue moving forwards. In this stable period I wanted to experiment in further simplifying the quantification process. For each of the health surveys on stress, anxiety, and depression there exists a lean version (PSS-4 for stress, GAD-2 for anxiety, and PHQ-2 for depression) which reduces the burden of question responses from 26 to a mere 8, and can act as a weather vane to the barometer, giving a simple indication if the wind has changed direction, in which case the longer version of the questionnaire can be used to uncover the specifics. Think of this like steering a large container ship with systems to plot the trajectory of ship (PSS-4) and if this looks like it will take it of coarse then a correction (PSS-10) is applied at the appropriate time to ensure the ship remains on coarse. In this way the surveys merely act as coarse correction for the well-being trajectory. The significantly reduced the burden of self-reporting, and enabled further testing with the interval period between the surveys; from shorter periods of every 3 days, to longer periods of every 2 weeks.
The proof is in the algorithm!
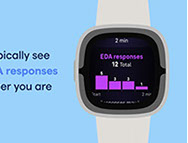
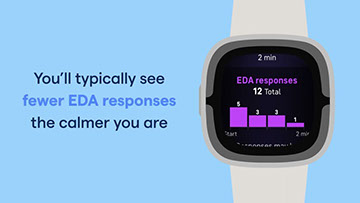
Another data value that was introduced during this month was the Fitbit own stress management score available when using the Fitbit Sense device and their premium service. According to Fitbit the score gives you daily insight into your body’s signs of stress. The score ranges from 1 to 100 where a higher number means your body is showing fewer physical signs of stress. In order for the Fitbit app to calculate a score you need to have taken at least 500 steps (at least made it out of bed!) Wear the device for at least 14 hours in a day, and wear the device at night for sleep. The score is based on 3 areas of data; the first is Responsiveness and relates to the autonomic nervous system (ANS) and measured by observing the HRV values during sleep, the resting HR, the sleep HR, and the electrodermal activity EDA from the Fitbit sense device. The second is Exertion and relates to the amount of physical activity looking at daily steps, weekly activity level, and fitness level vs exercise fatigue. Finally the score uses Sleep patterns looking at the total sleep over the past week, restlessness and other indicators of disrupted sleep, and time spent in REM & deep sleep.
What was interesting to understand is how well the Fitbit score compared to my own algorithm for well-being. Over that week the average Fitbit stress management score was 82.4 and the average for my well-being score was 77.4 indicating there was a close approximation to the score, and more importantly they both followed the same fluctuations during the week. To have a better idea on the comparison more data over a longer period time would be needed.
One of the reasons why my well-being score was now regularly in the 70’s was due to improvement in my sleep patterns. Which had gone from a weekly average of 7 hours a night to a weekly average of 7.5 hours a night. This may not sound like much of an improvement but when drilling down into the data it showed that I was getting consistently more REM and deep sleep leading to an overall improvement in sleep quality.
Perchance to sleep!
It has long been known, and many studies have proven, the close relationship between sleep and mental well-being. It is claimed that one in three suffer from poor sleep, and the consequences can affect both mental and physical health, making us feel physically unwell, and is linked to heart disease, diabetes, premature ageing and road accident deaths. Sleep has an important restorative function in ‘recharging’ the brain at the end of each day, just like we need to charge a mobile phone battery after prolonged use. Maintaining a regular sleep-wake cycle allows the natural rhythm of the body to be reset every day and therefore optimises brain functioning and can improve mental health. Ongoing poor sleep can be a huge risk factor for the development of major depressive disorder. The risk of feeling depressed and/or anxious (as well as worsening existing anxiety and depression) increases with the severity of insomnia, and so it is very important to recognise and sort out sleep problems as soon as they are identified.
Commonly accepted ways to help improve sleeping habits are:
- establish a regular sleep-wake cycle; try to sleep and wake at regular times consistently.
- try to ensure that you have a comfortable bed and bedroom; noise, temperature, and especially light should be tailored to promote sleep as much as possible.
- limit the use of stimulants; such as caffeine, nicotine and alcohol for at least several hours before you go to sleep.
- avoid going to bed until you are drowsy and actually ready to sleep; Most people who suffer from insomnia tend to spend more time in bed lying awake, often looking at mobile device screens, rather than actually asleep.
- avoid electronic devices late at night; such as computers, mobiles, tablets and so on; as well as preventing you from switching off, the bright light can be overly stimulating and keep you awake.
- take regular daily exercise; this helps to naturally wind down the body and mind, but avoid it being too late in the evening as this could be stimulating.
Fast forward to 1st June 2021 and 58 days into the experiment. My stress is presenting as mild, anxiety and depression are both low, sleep duration and quality are good and stable, and well-being score is now consistently above 80. Game over? You could be forgiven for thinking, and I also had the same thoughts, but 80 is not 90 and there still felt there was much further to go. Part of feeling this way is that the hidden physiological changes that the algorithm detects including increase in baseline HRV to 28ms (40% increase) and lowering of the average resting HR to 55bpm (reduction of 21%) are lagging factors for positive well-being, whilst still reacting to immediate changes to physiology, HRV responds to poor sleep, or intense exercise, but changes to baseline levels take much longer and a require an extended period of positive experience. So whilst externally things seems to have plateaued, stress, anxiety, depression levels, sleep duration and quality, these other more hidden factors are still changing in the background, which in time will reflect on the well-being score.
The other reason for the increasing well-being score is aligned to increases in my activity level since the start of the experiment. This is evident with the increased average step count by 32% since I started. The reason behind this increase is the simple act of walking.
Walking - the elixir of life!
Studies of walking’s benefits date back to the 1950s, recent research has ben preoccupied with the target of 10,000 steps a day and the use of activity trackers. What they tell us is that while all these tools urge us towards step count goals, there really isn’t exactly a magic number to achieve. The figure 10,000 was dreamed up as part of a 1960s pedometer marketing campaign in Japan, and a recent study indicates that half that amount can be beneficial, and a levelling off in benefits is seen after about 7,500 steps. Heath services advise that just 10 minutes of brisk walking each day makes a difference. For an activity many of us do each day without thinking, this seems remarkable, but it’s estimated that when walking over half our body’s muscle mass is engaged, and the benefits of even a moderate pace – around three miles an hour – range from improved cardiovascular health, like lower blood pressure, to better glucose metabolism, musculoskeletal health, and mental wellbeing. Where you walk can also have a big impact, there is a growing body of research to back up the idea that being in nature improves not simply mental but physical health. American philosopher, Arnold Berleant, argues, it is when we’re actually moving through a landscape, rather than treating it simply as scenery, that we most fully connect with a place and ignite all our senses. According to research, every 2,000 steps walked reduces the risk of premature death incrementally by eight per cent to 11 per cent, up to approximately 7,000 steps a day. Walking at a faster pace also shows positive outcomes for heart disease, cancer, dementia and death, over and above the total number of daily steps taken. Several, new studies have shown that walking at least fifteen minutes every day can add seven years to your life. Who does not want the chance to live longer, to spend more time with family and friends, to achieve more in your life? Just get up and walk, simple as.
Skipping forward to Sunday 1st August 2021 and approaching half way through the experiment. It has been quite a journey so far and with all its complications and considerations has now become almost habitual. It is this week I recorded my first well-being score of 92 (WooHoo!) and a comparable Fitbit stress score of 90. The earlier coping strategies in managing stress, anxiety, and depression have resulted in presenting low levels across the board. Attention to good sleep hygiene, and awareness that just getting out every day for a short walk in nature is boosting well-being. This routine and boost has also helped me to rediscover my love for running over the summer. The regular walks were now transitioned into regular runs, having an even more beneficial effect on my physiological data, especially fitness levels shown by improvements to my VO2 max data.
We are what we eat!
The increase in activity also had the effect of bringing my attention to food and nutrition, being more active brings closer attention to what and when you eat. There has long been a well established relationship between what you eat and how you feel. There is also a clear relationship between the food your body needs to maintain a moderately active lifestyle and the amount of food energy to consume.
There are a few basic rules of thumb that can help provide guidance; it is important to have a balanced diet, with enough protein, carbohydrates, fats, vitamins, and minerals, and to have varied source of protein including (for non vegetarians and vegans) fish, and white meat. Similarly with plant based diets where proteins come from soya, bean, nuts, and certain vegetables. A normal healthy male requires approx. 2500 calories and female approx 2000 calories a day. This can vary depending on activity intensity, however simple math means that you should aim to consume only what the body needs. Unlike convention and habit would determine it is not necessary to consume this in 3 distinct meals a day, but to align consumption more to your bodies needs, and observing some key observations; such as avoiding a large meal before active exercise, and avoid eating for at least 2 hours before sleep. There is also a growing body of research that points to the adverse effect ultra-processed food can have on well-being and these foods should be avoided, opting for whole foods, whole grains, and whole fruits. Similarly certain additives when consumed by continuing to eat the same types of food accumulate in the body and have a negative effect on health, and should be avoided where possible, and opt for a more varied diet.
To help me understand the effect food consumption was having on my body, I added a subcutaneous glucose tracking patch to my quantified data analysis. With the companion mobile app and simply tapping the phone on the skin patch this was able to show me how my glucose levels changed when eating different foods, and to work out which foods lead to a sharp rise in glucose levels, and those that result in a more slow gradual release. With this information I could make better decisions on which foods to eat, and importantly at what time is the optimal to maintain a balanced glucose level throughout the day in relation to my bodies needs.
Jumping forward all the way to 31st March 2022 and the end of the documented part of the experiment. In actual fact much of the daily data capture was now automatic simply using the Apple Watch and Oura ring. I had stopped using the Fitbit Sense (and all other wearable devices) a few months previous since they were no longer providing any new data. Mood capture is only being done on an ad-hoc basis in relation to changes in mood along with context and journaling. The health surveys now act as previously described in relation to being used for course correction, and taken when I have a sense, or the well-being score predicts, potential decline in stress, anxiety, or depression. With the accumulated date over the past 12 months and the refinements in the algorithm, it is now possible to use the data and individual patterns to plot forward the likely path the well-being score would take and highlight any potential negative trends in well-being for which I can consider corrective action from the knowledge of coping strategies built up over the past 12 months. My ‘go-to’ coping strategy still remains getting out and going for a brisk walk in nature. One of the key things I have learned is I need to have activity and exercise in my life, along with mental stimulation.
With this more autonomous ‘sixth-sense’ measure of well-being, I can now use the time previously spent monitoring and analysing data to consider the sequel to this story; in the guise of achieving purpose, character, meaning, and self-actualisation. As this is still a work in progress I will come back to this in a future post.
The long way up?
How do I summarise what I have learned in the year of quantifying, measuring, and analysing my well-being? It has been quite a journey and an education, at times intense and at others mundane. I have certainly leaned new things about who I am as a person, what influences and triggers my mood, and the best coping strategies that work for me. The good thing is It is not necessary to go through a year of intense measurement to come to similar insights, but it does start, as with many things, in truly knowing what you are feeling, and honestly working out why you feel this way, and trusting how you might cope with these feelings. In practical terms there is no one easy fix, and that everyone is unique in their own way, so what worked for me does not necessarily mean it will work for everyone. However I did find that once you have a grasp as to where you are with your sense of well-being, working on improving sleep (duration and quality) is a good place to start, as this will have some immediate restorative effect and boost well-being giving extra motivation to move forward with the more challenging aspect of getting into a more active routine. For me it was a revelation, validated through my measurements, just how much impact a simple 15 minute brisk daily walk, in nature if possible, can have on well-being, and this can be a catalyst to taking on more intense exercise. With a grasp on sleep and activity it is easier to move onto the 3rd of the well-being ‘holy trinity’, that of nutrition. I found being more active gives you a natural sense of responsibility around what and when you eat, as you become more in-tune with your bodies needs. There is a simple rule which applies to many areas of life, and that is junk in = junk out. In the same way we should be careful about what drugs we put into our bodies we should give food the same level of consideration. In a world of consumerism and fast food, we have perhaps lost sight of the importance of what food is - the energy of life!
I hope you found this story of my year long experiment with well-being interesting, maybe informative, and hopefully trans-formative. As in all good movies where you know there may be a sequel coming; this is to be continued…
LEAVE A COMMENT